Science Art and Visualizations
Click images to see full resolution and more information. Unless otherwise stated, all images can be used for non-commercial purposes, with credit to Claire Lamman (CC BY-NC 4.0).
A slice of DESI's 5-year survey
A thin slice of DESI's original 5-year survey. Earth is at the center of the wedge, with a slice from the North Galactic cap (above the Milky Way) on top and the South Galactic cap (below the Milky Way) on bottom. The gap between them is dark because it contains galaxies obscured by our own galaxy.
Light from the furthest galaxies shown is 11 billion years old by the time it reaches Earth; leaving those galaxies when the universe was just ⅕ its current age and ⅓ its current size!
The enhanced section contains DESI's Bright Galaxy Survey, which traces the large-scale structure of the universe. This section extends about 1 Gpc away from Earth, or 3.3 billion light years, or 20,000,000,000,000,000,000,000 miles (2e22).
Full butterfly
A 3 degree slice of sky, extending out to redshift z ~ 4.
Full NGC slice: 2 < DEC < 5 deg
Full SGC slice: −10 < DEC < −7 deg
Colors represent the different DESI tracers, in order of distance from Earth: Bright Galaxy Sample (a dense sample of all types of galaxies), Luminous Red Galaxies (big red ellipticals), Emission Line Galaxies (mostly blue spiral galaxies), and the most distant are Quasars.
Enhanced butterfly
A 10 degree slice of sky, extending out to redshift z ~ 0.2.
NGC slice: −5 < DEC < 5 deg
SGC slice: −15 < DEC < −5 deg
Colors and transparency of the points are scaled by DEC, i.e. brighter colors trace structure 'in front of' darker background galaxies.
Original press release. Credit: Claire Lamman / DESI Collaboration
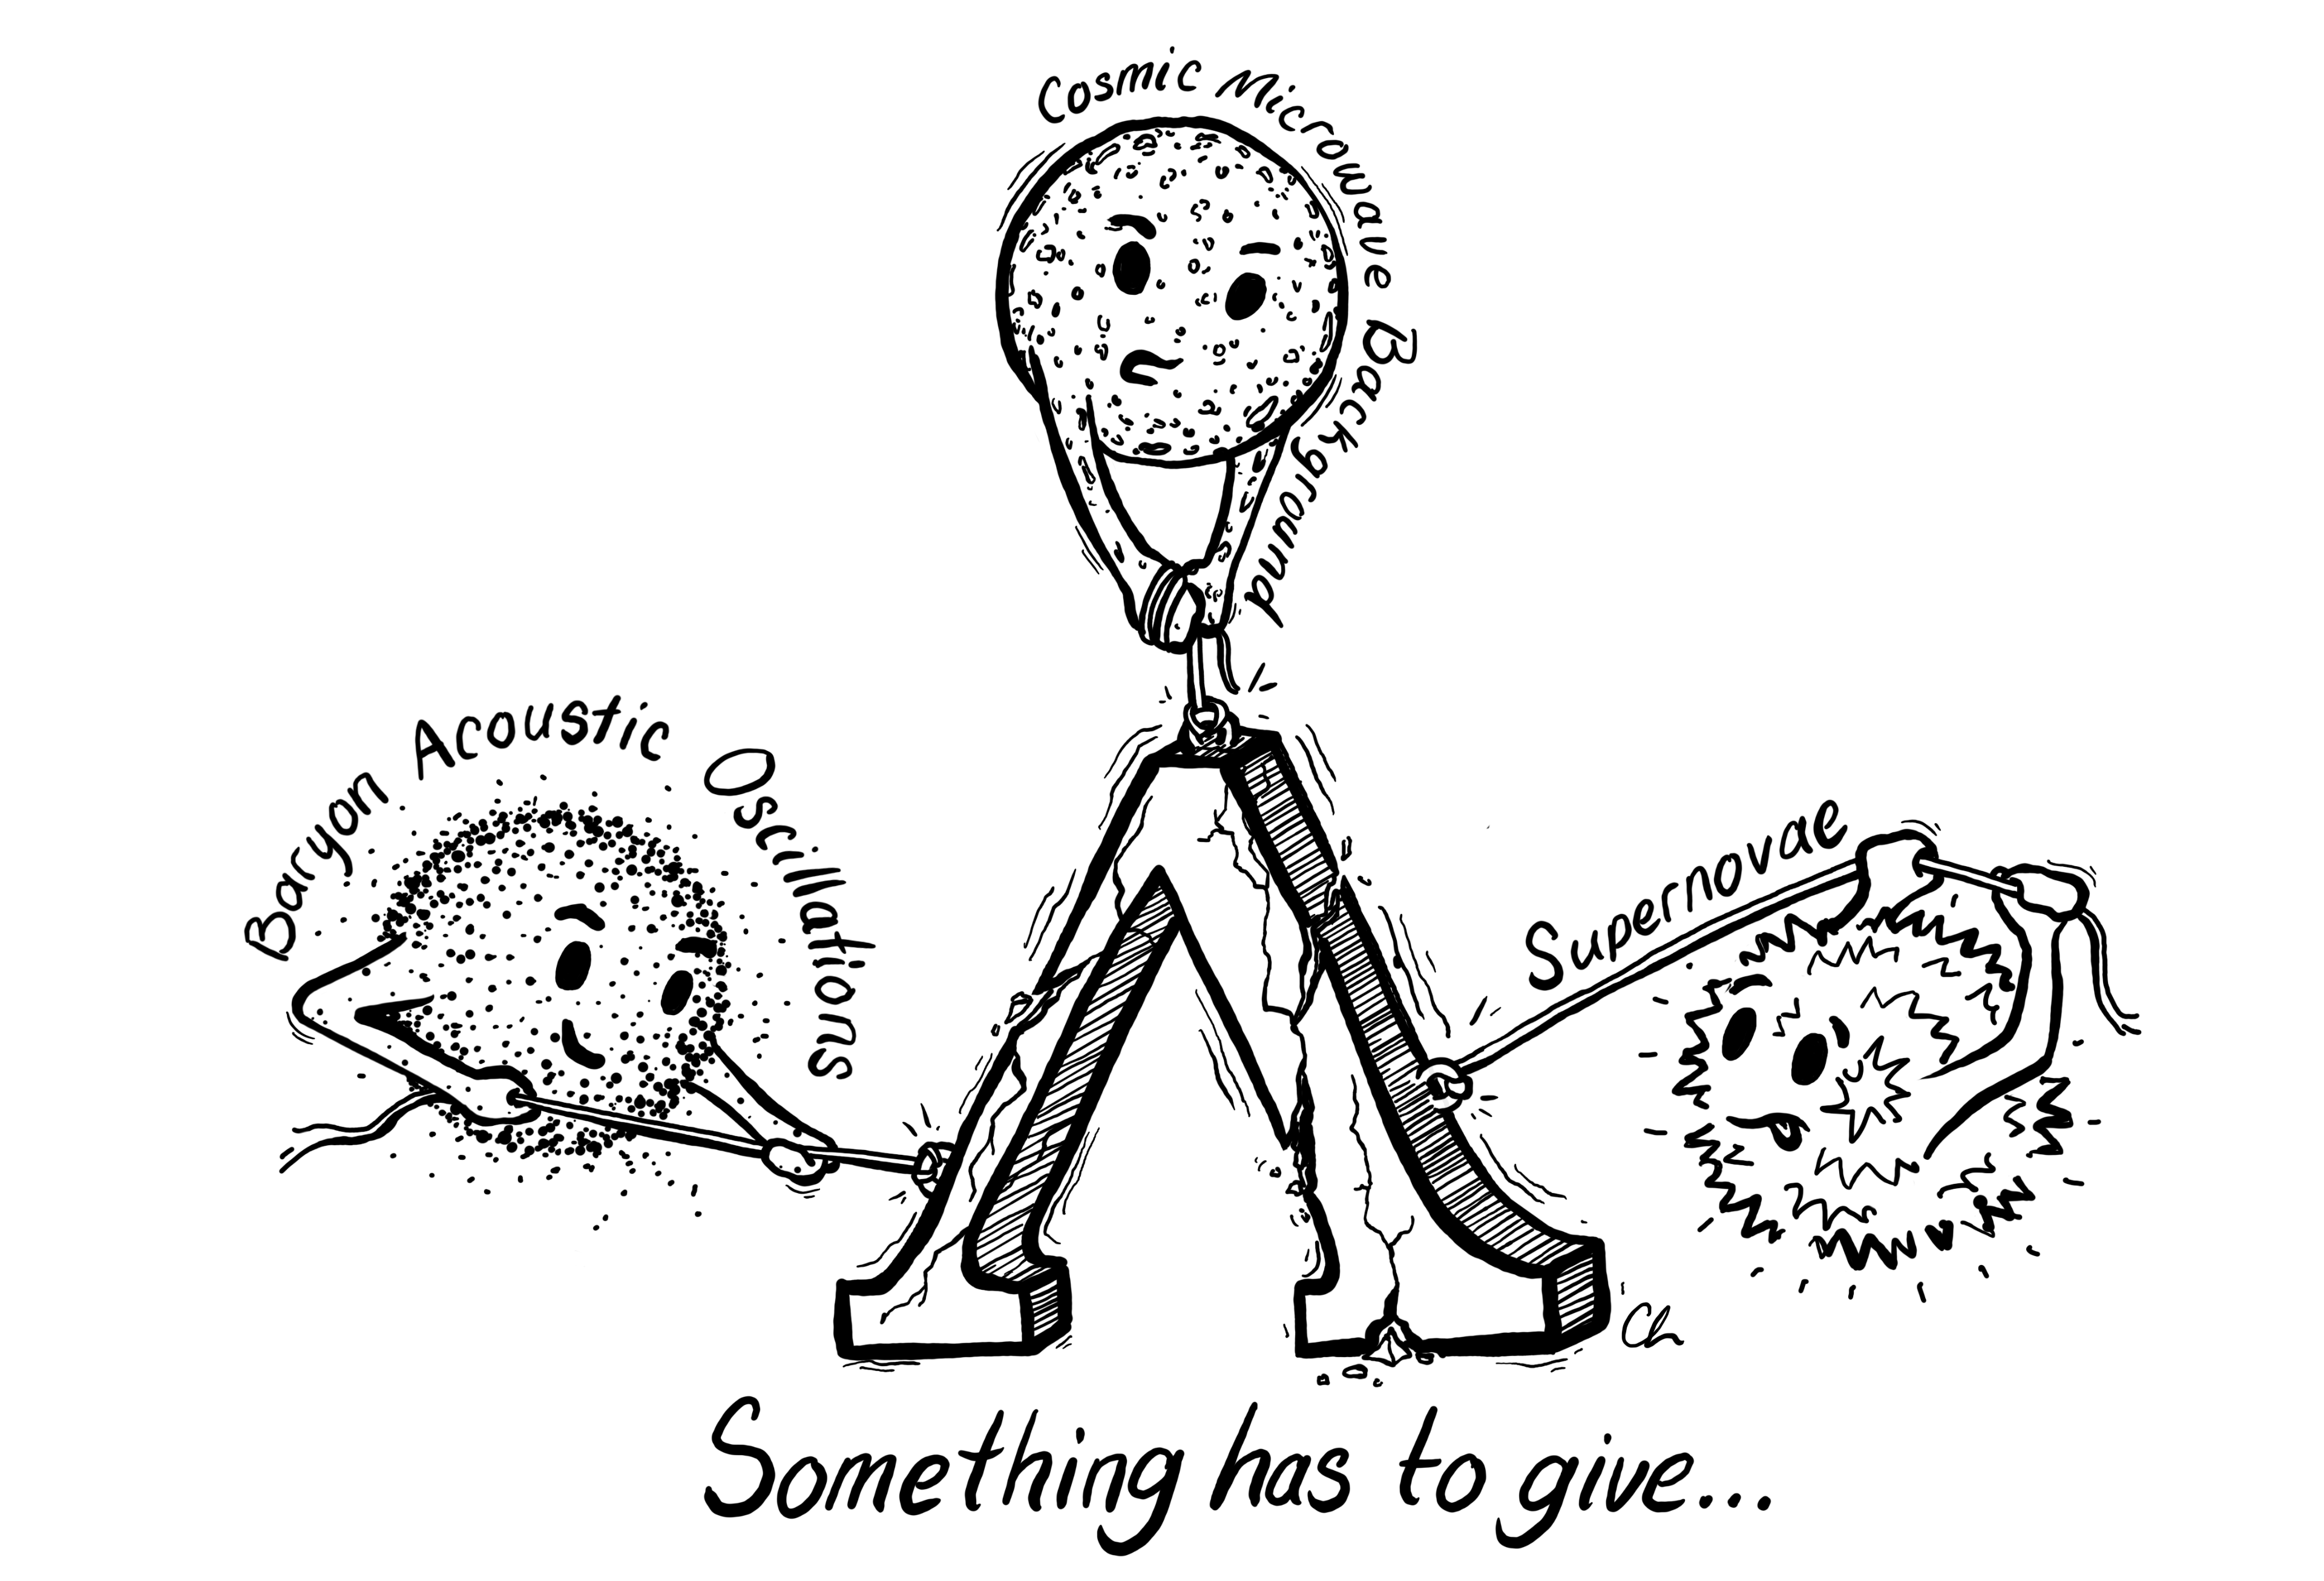
Something must give
A visualization of recent dark energy results from the DESI Survey. Credit: Claire Lamman
Cosmic Cartography
An old-style map celebrating DESI's efforts to chart the Universe. See this blog post for a description of the details. Credit: Claire Lamman
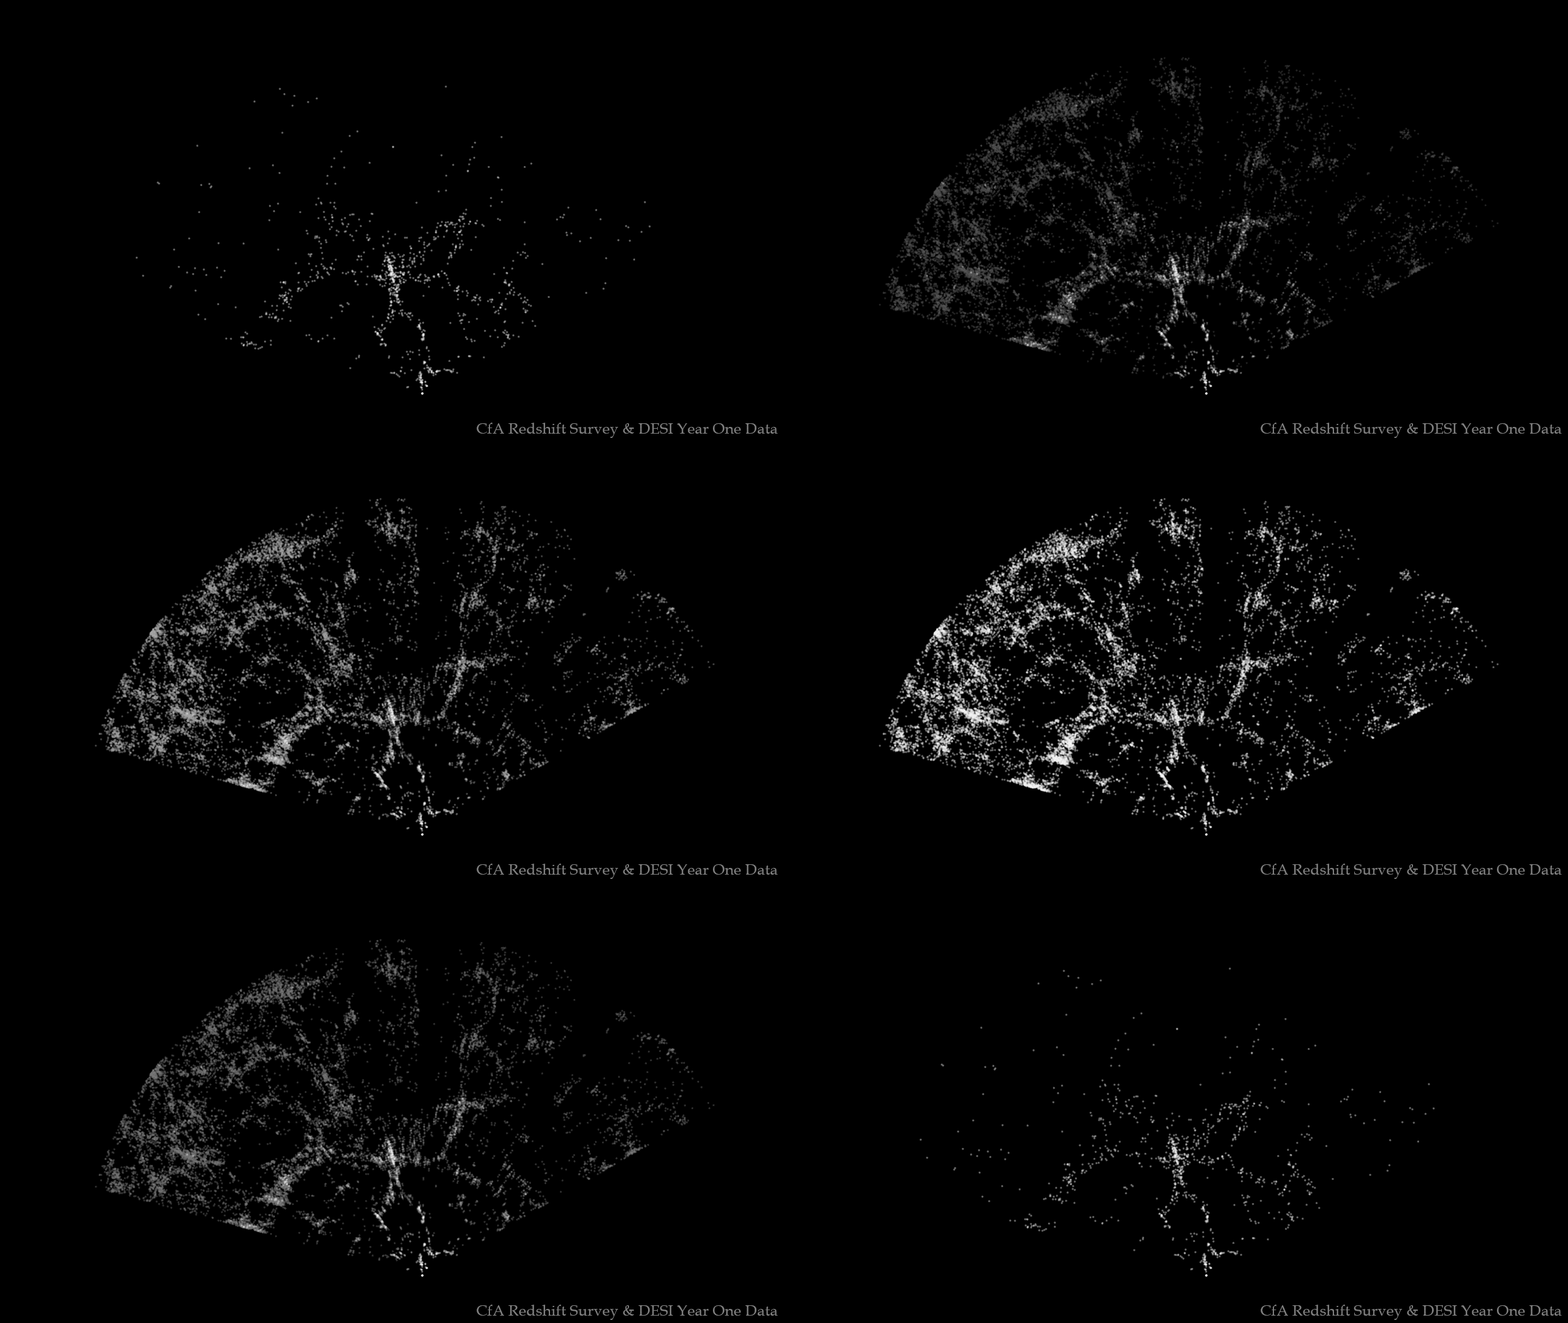
The CfA "stickman," then and now
Comparison between the famous CfA "stickman" and the same slice with DESI Y1 galaxies. See this blog post for more information. Credit: Claire Lamman | The CfA Redshift Survey: Data for the NGP +30 Zone. Huchra, Geller, de Lapparent, Corwin 1990

DESI's map and focal plane
Design of DESI's LSS map and focal plane. Credit: Claire Lamman
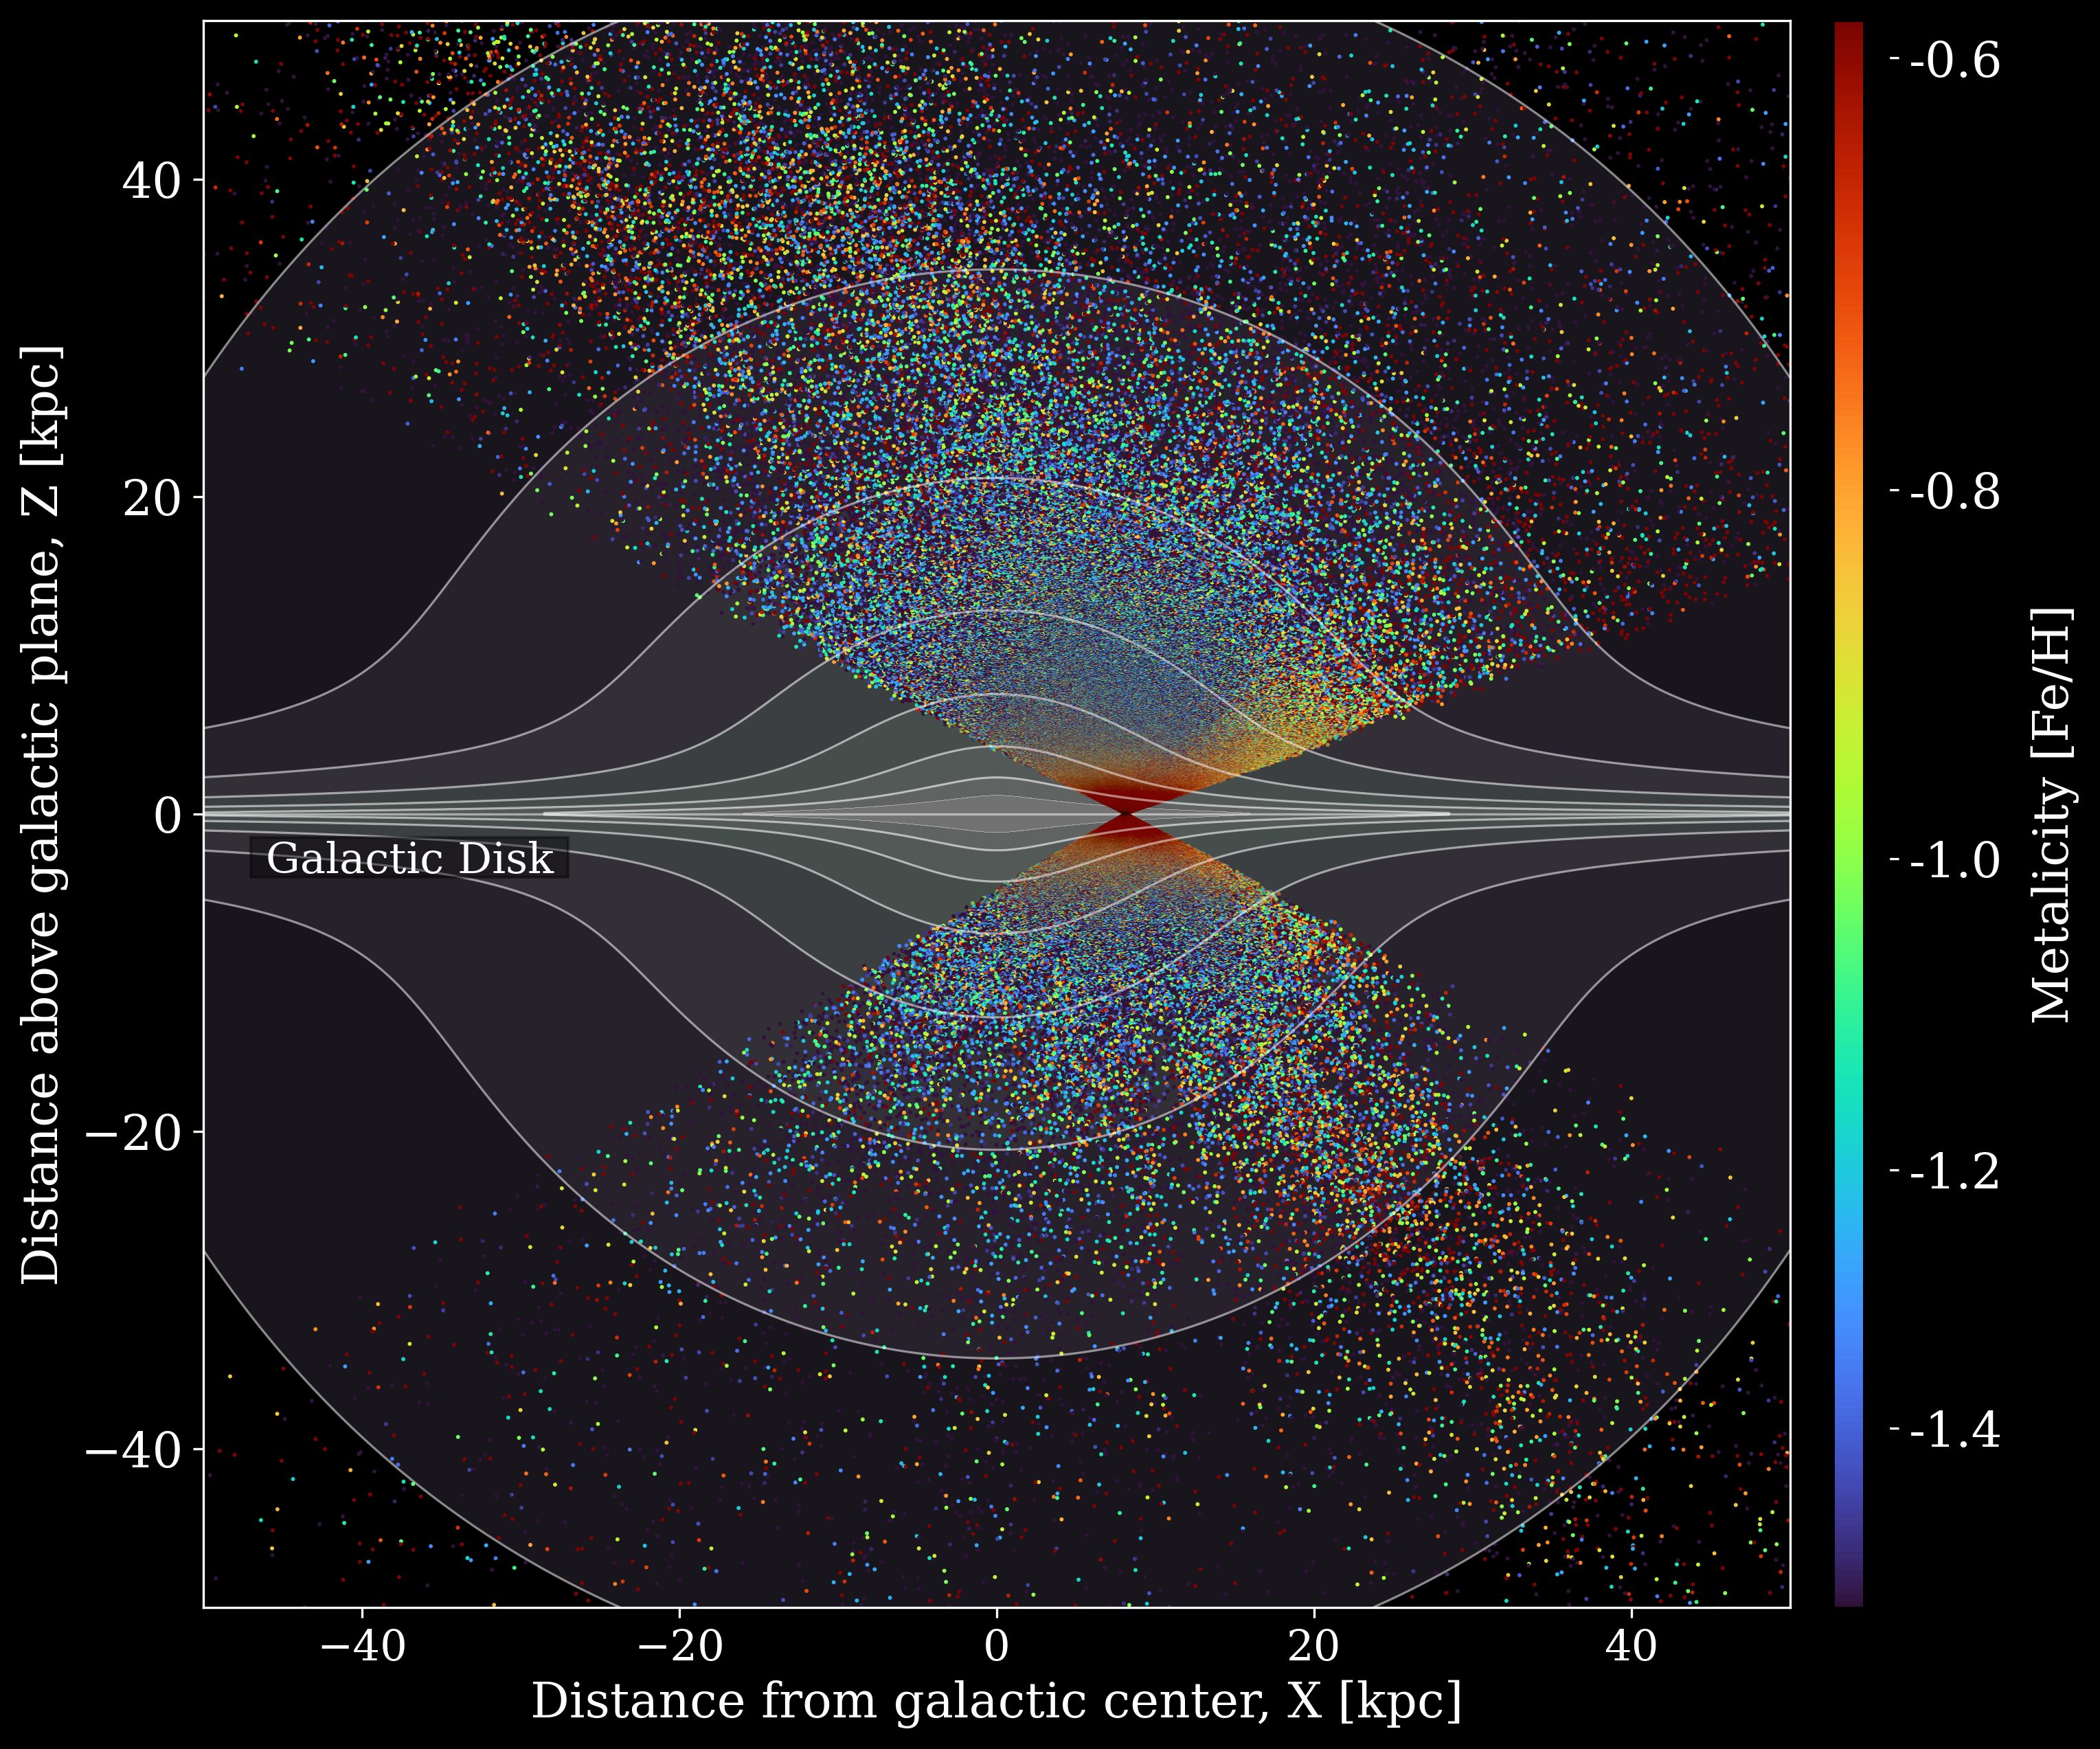
Milky Way stars in DESI DR1
Distribution of Milky Way stars in DESI's first data release. The colors of individual points represent spectroscopically inferred iron abundance, and the thin curves represent the stellar mass density of the galactic disk. Published in DESI Collaboration et al., 2026.
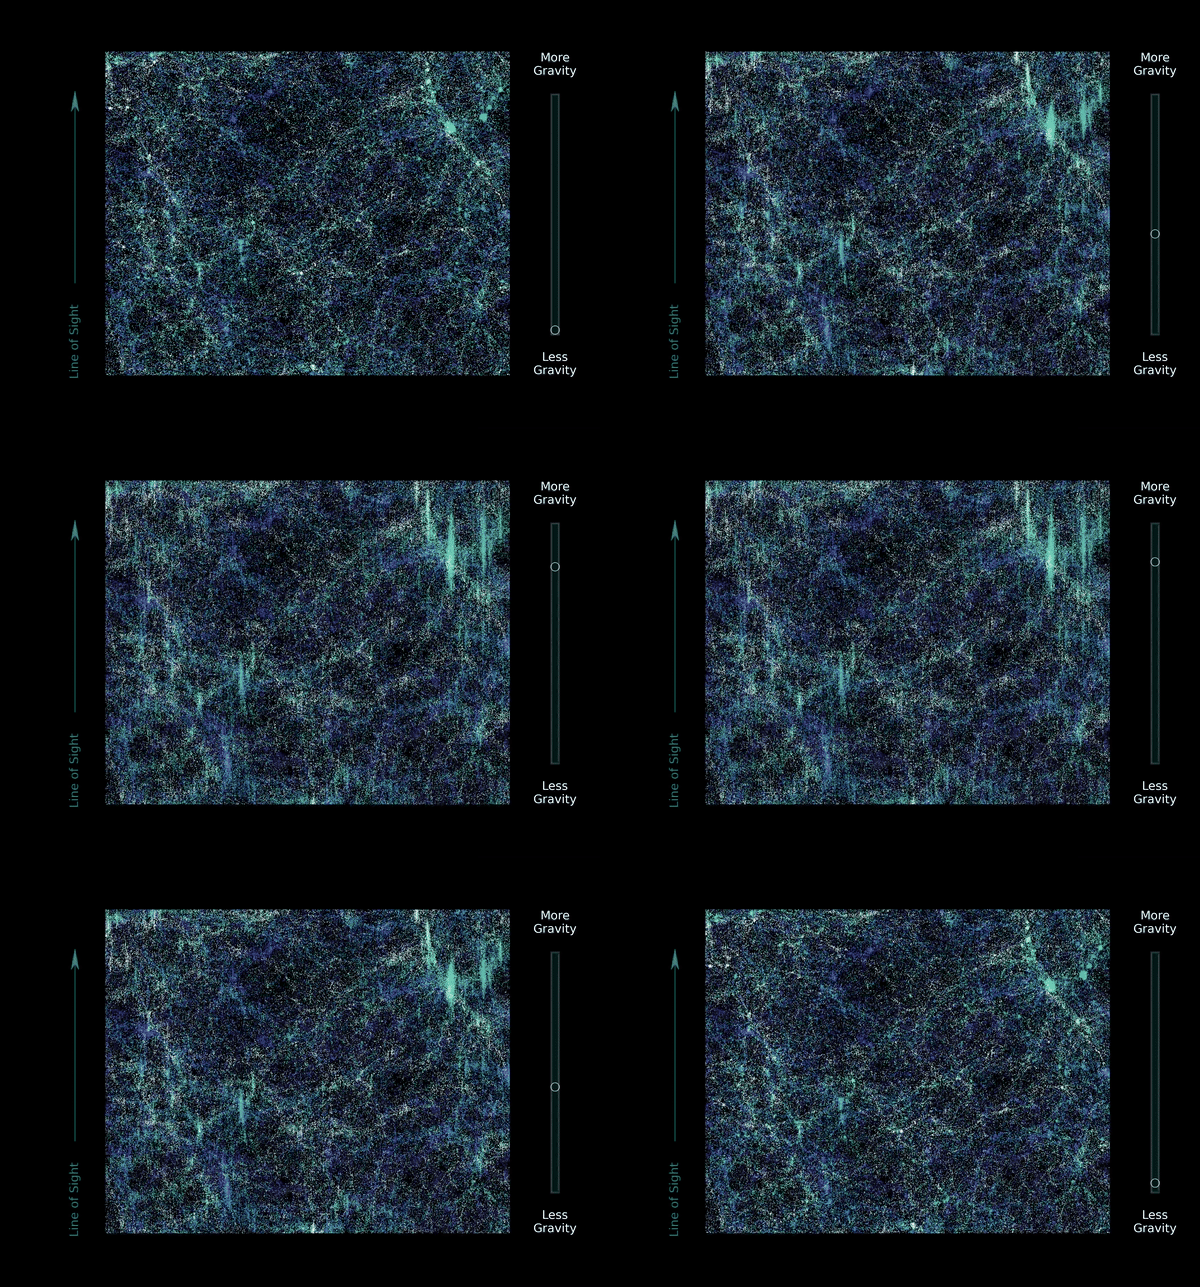
Redshift-space distortions
Visualization of RSD created for a DESI press release (press release and high quality image coming soon!). Credit: Claire Lamman
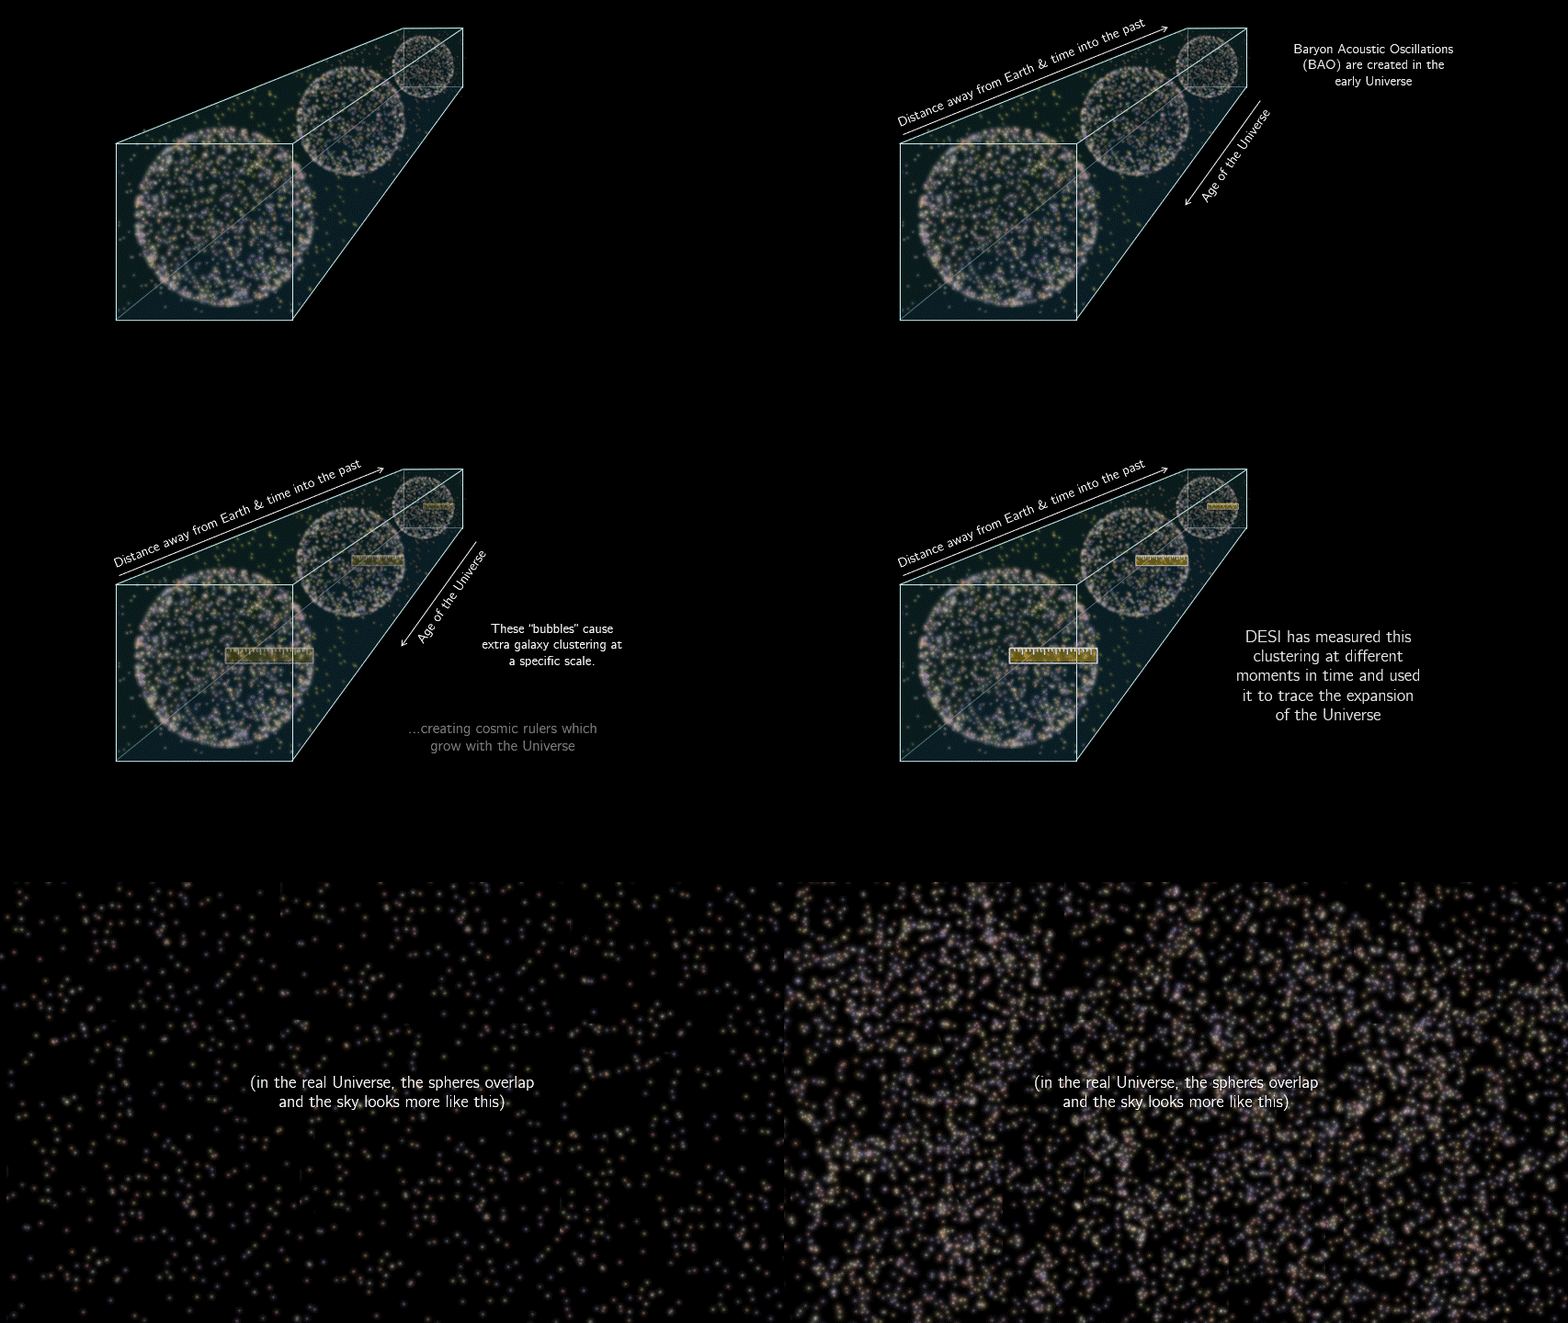
Baryon acoustic oscillations
Visualization of BAO created for DESI's Y1 press release. For the final visualization, see this video from Berkeley Lab. Credit: Claire Lamman
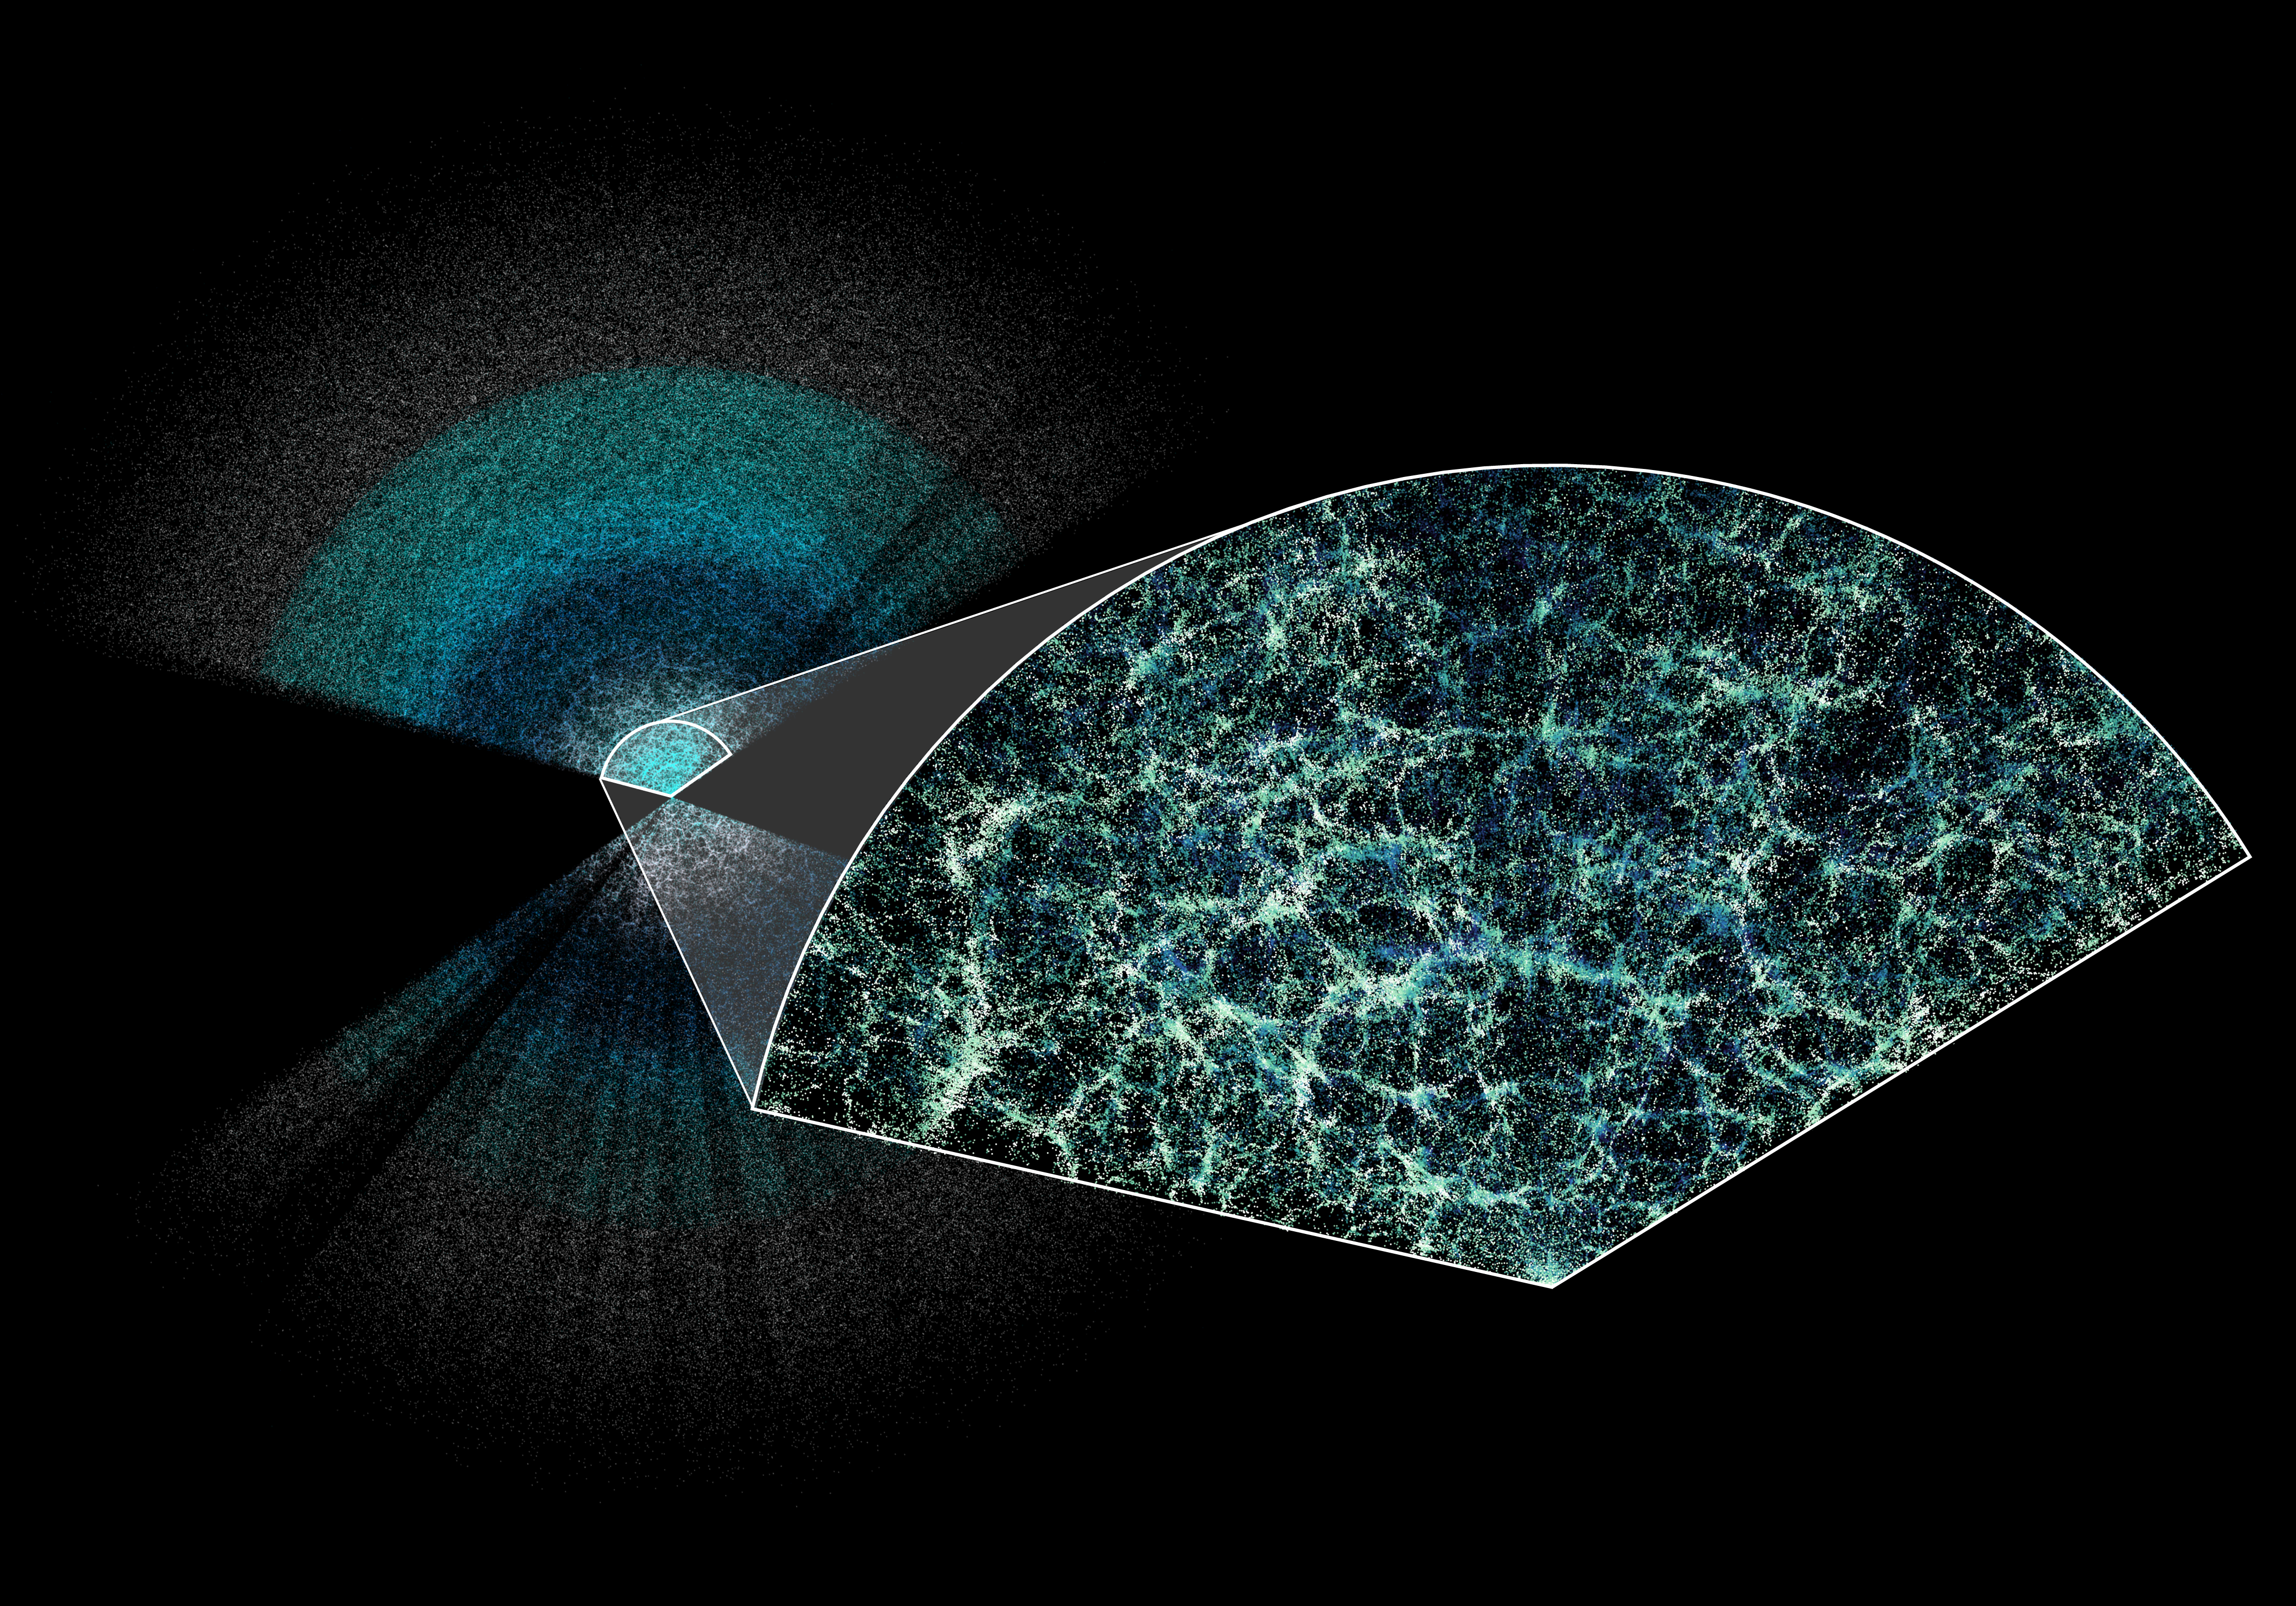
DESI Year 1 slice
This key figure was used in DESI's Y1 press release, displaying a narrow band on the sky spanning 190 degrees in right ascension and 14 degrees in declination. The magnified section consists of galaxies from our Bright Galaxy Sample and extends to a redshift of 0.2. The colors are scaled by declination to show depth in the slice: darker colors are "behind" brighter structure.
In the background "butterfly", colors correspond to different types of galaxies observed: Bright Galaxy Survey, Luminous Red Galaxies, Emission Line Galaxies, and Quasars. This represents less than 0.1% of our full survey volume.
Image credit: Claire Lamman / DESI Collaboration; custom colormap package by cmastro.
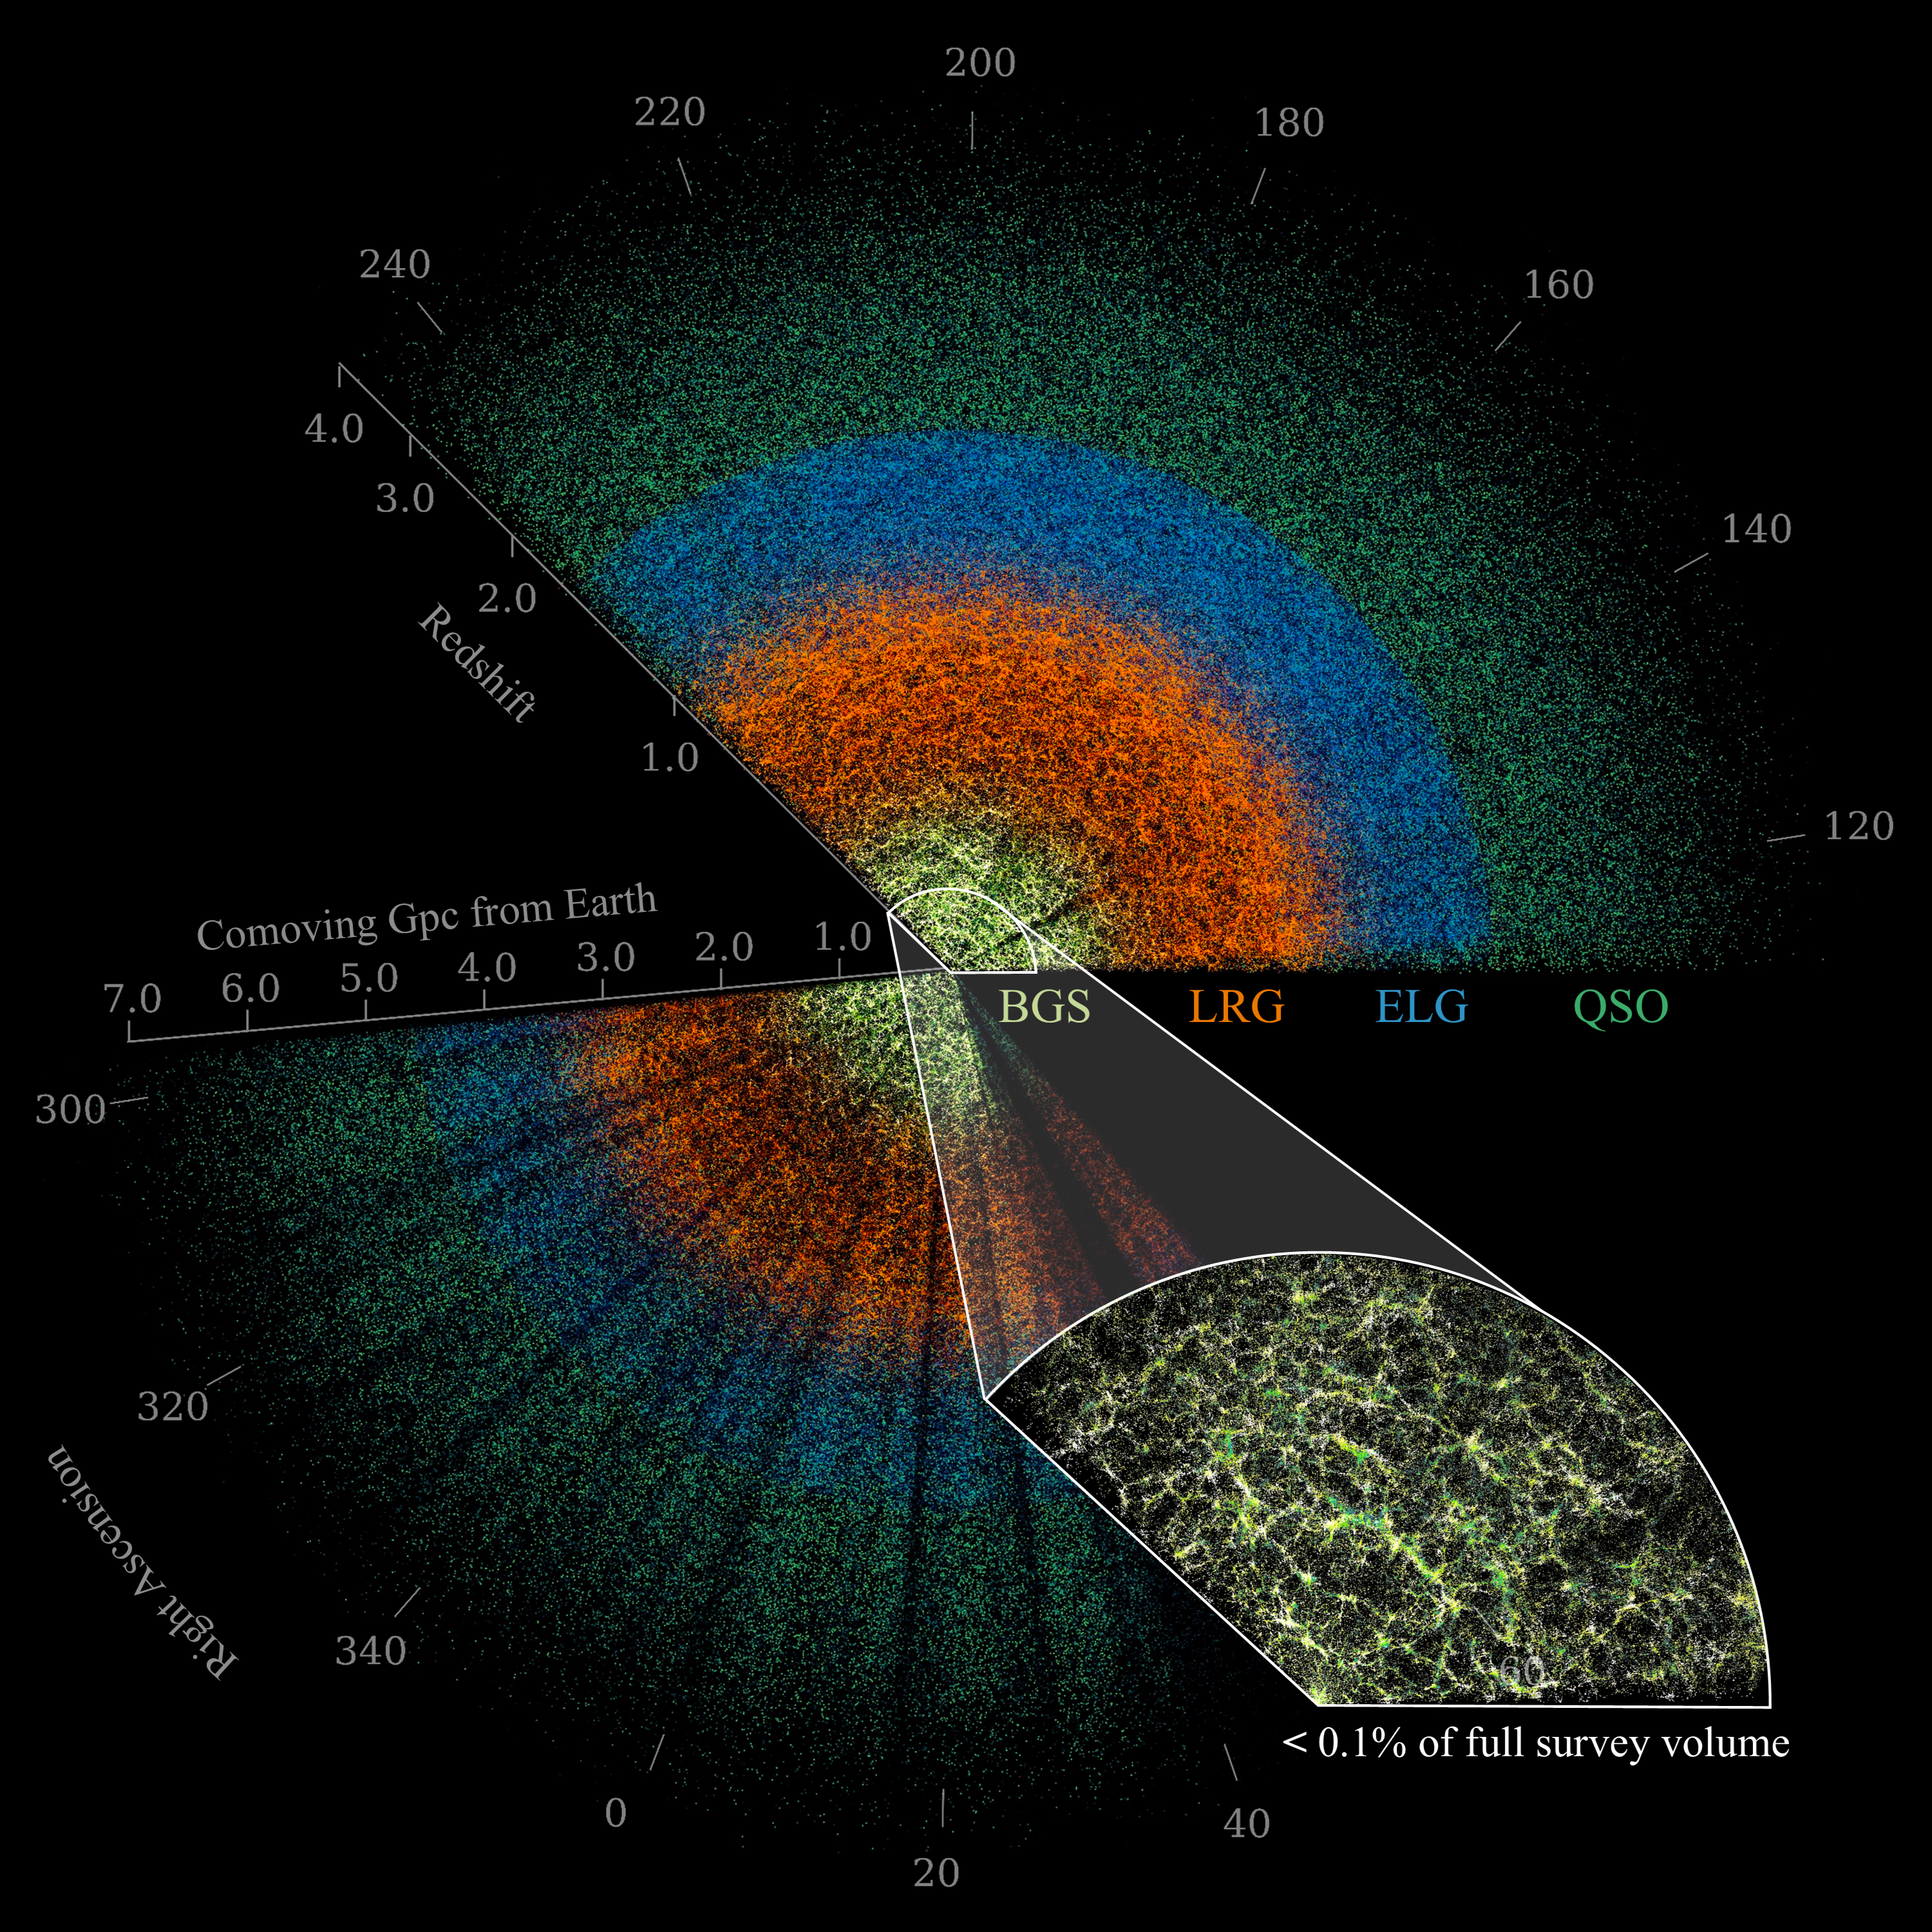
A slice of the Universe from DESI DR1
Slice of the Universe mapped by DR1 drawn from a small wedge of the DESI footprint between ±5° in decl. out to z ≈ 4. We render the four major extragalactic samples (BGS galaxies, LRGs, ELGs, and QSOs) using yellow, orange, blue, and green points, respectively. Within each target class, the shade of the color maps to decl. (lighter colors correspond to higher decl.).
The inset shows a subset of the BGS survey extending out to redshift z = 0.2, highlighting the LSS traced by galaxies in the densest survey region. For reference, this small wedge of the BGS survey represents less than 0.1% of the comoving cosmological volume in DR1.
Published in DESI Collaboration et al., 2026.
BaoBan comics
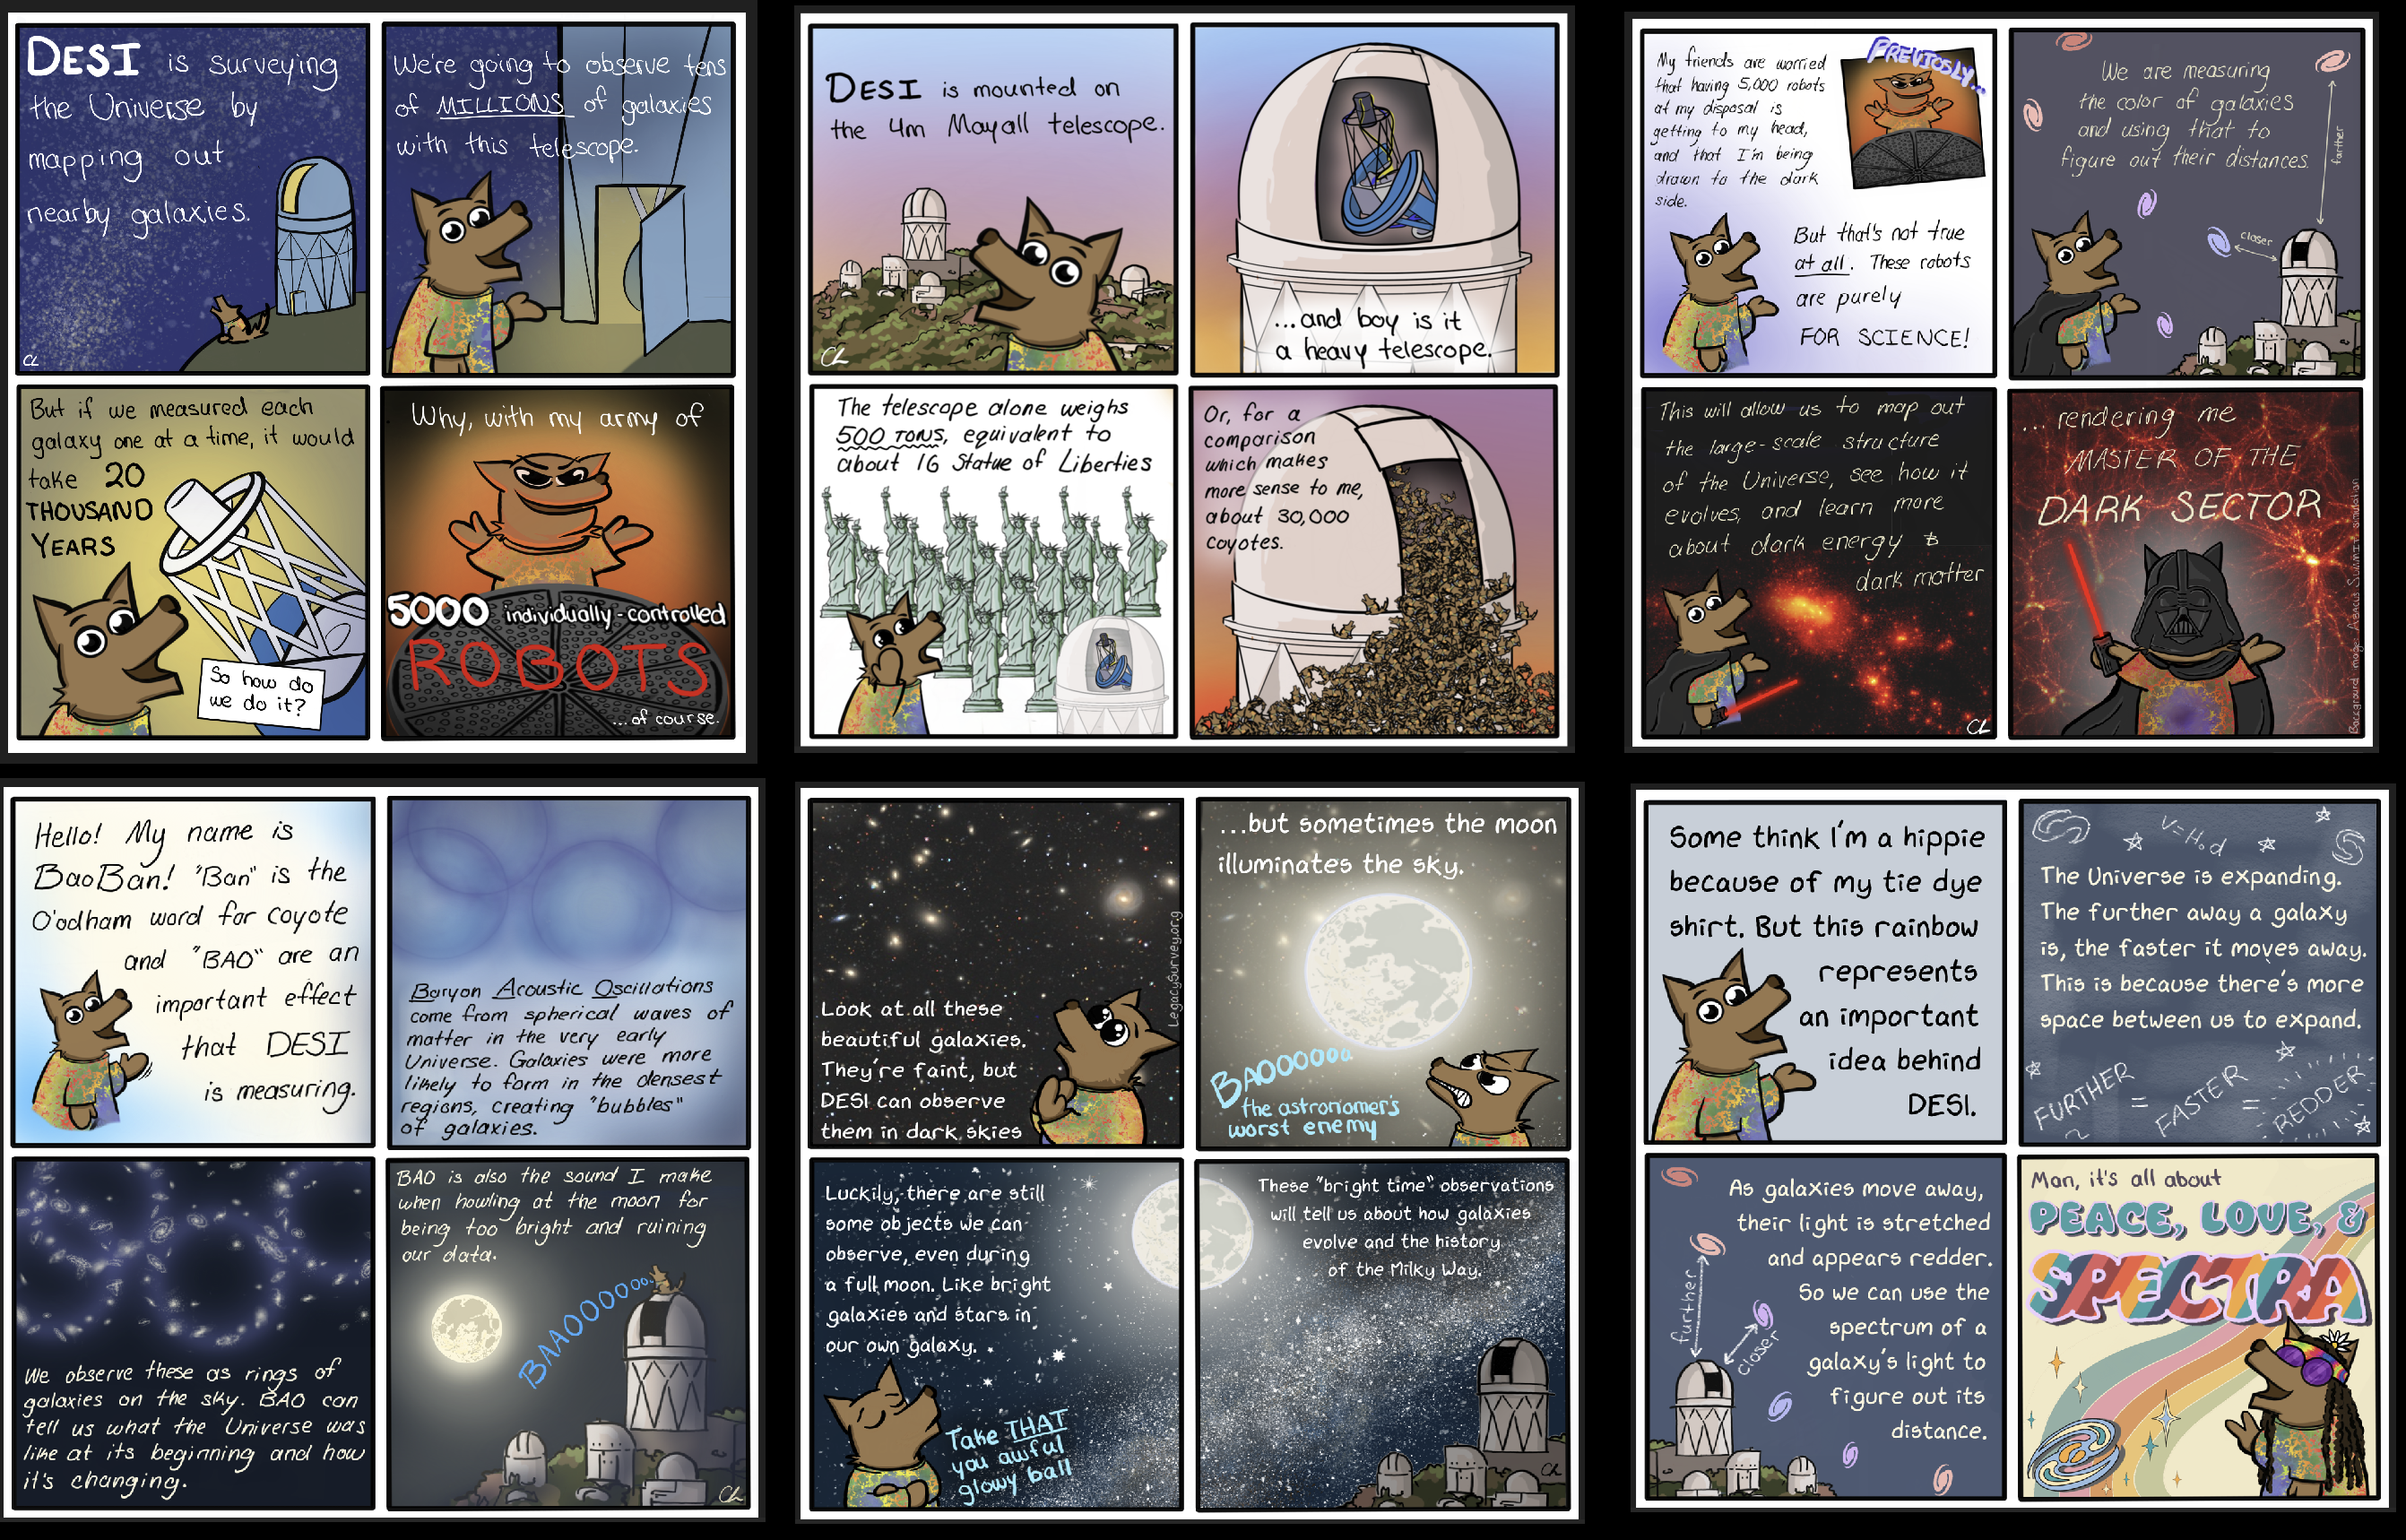
A series of comics featuring DESI's ambassador, BaoBan. Click here to see the full series. Credit: Claire Lamman
Astro-themed bakes
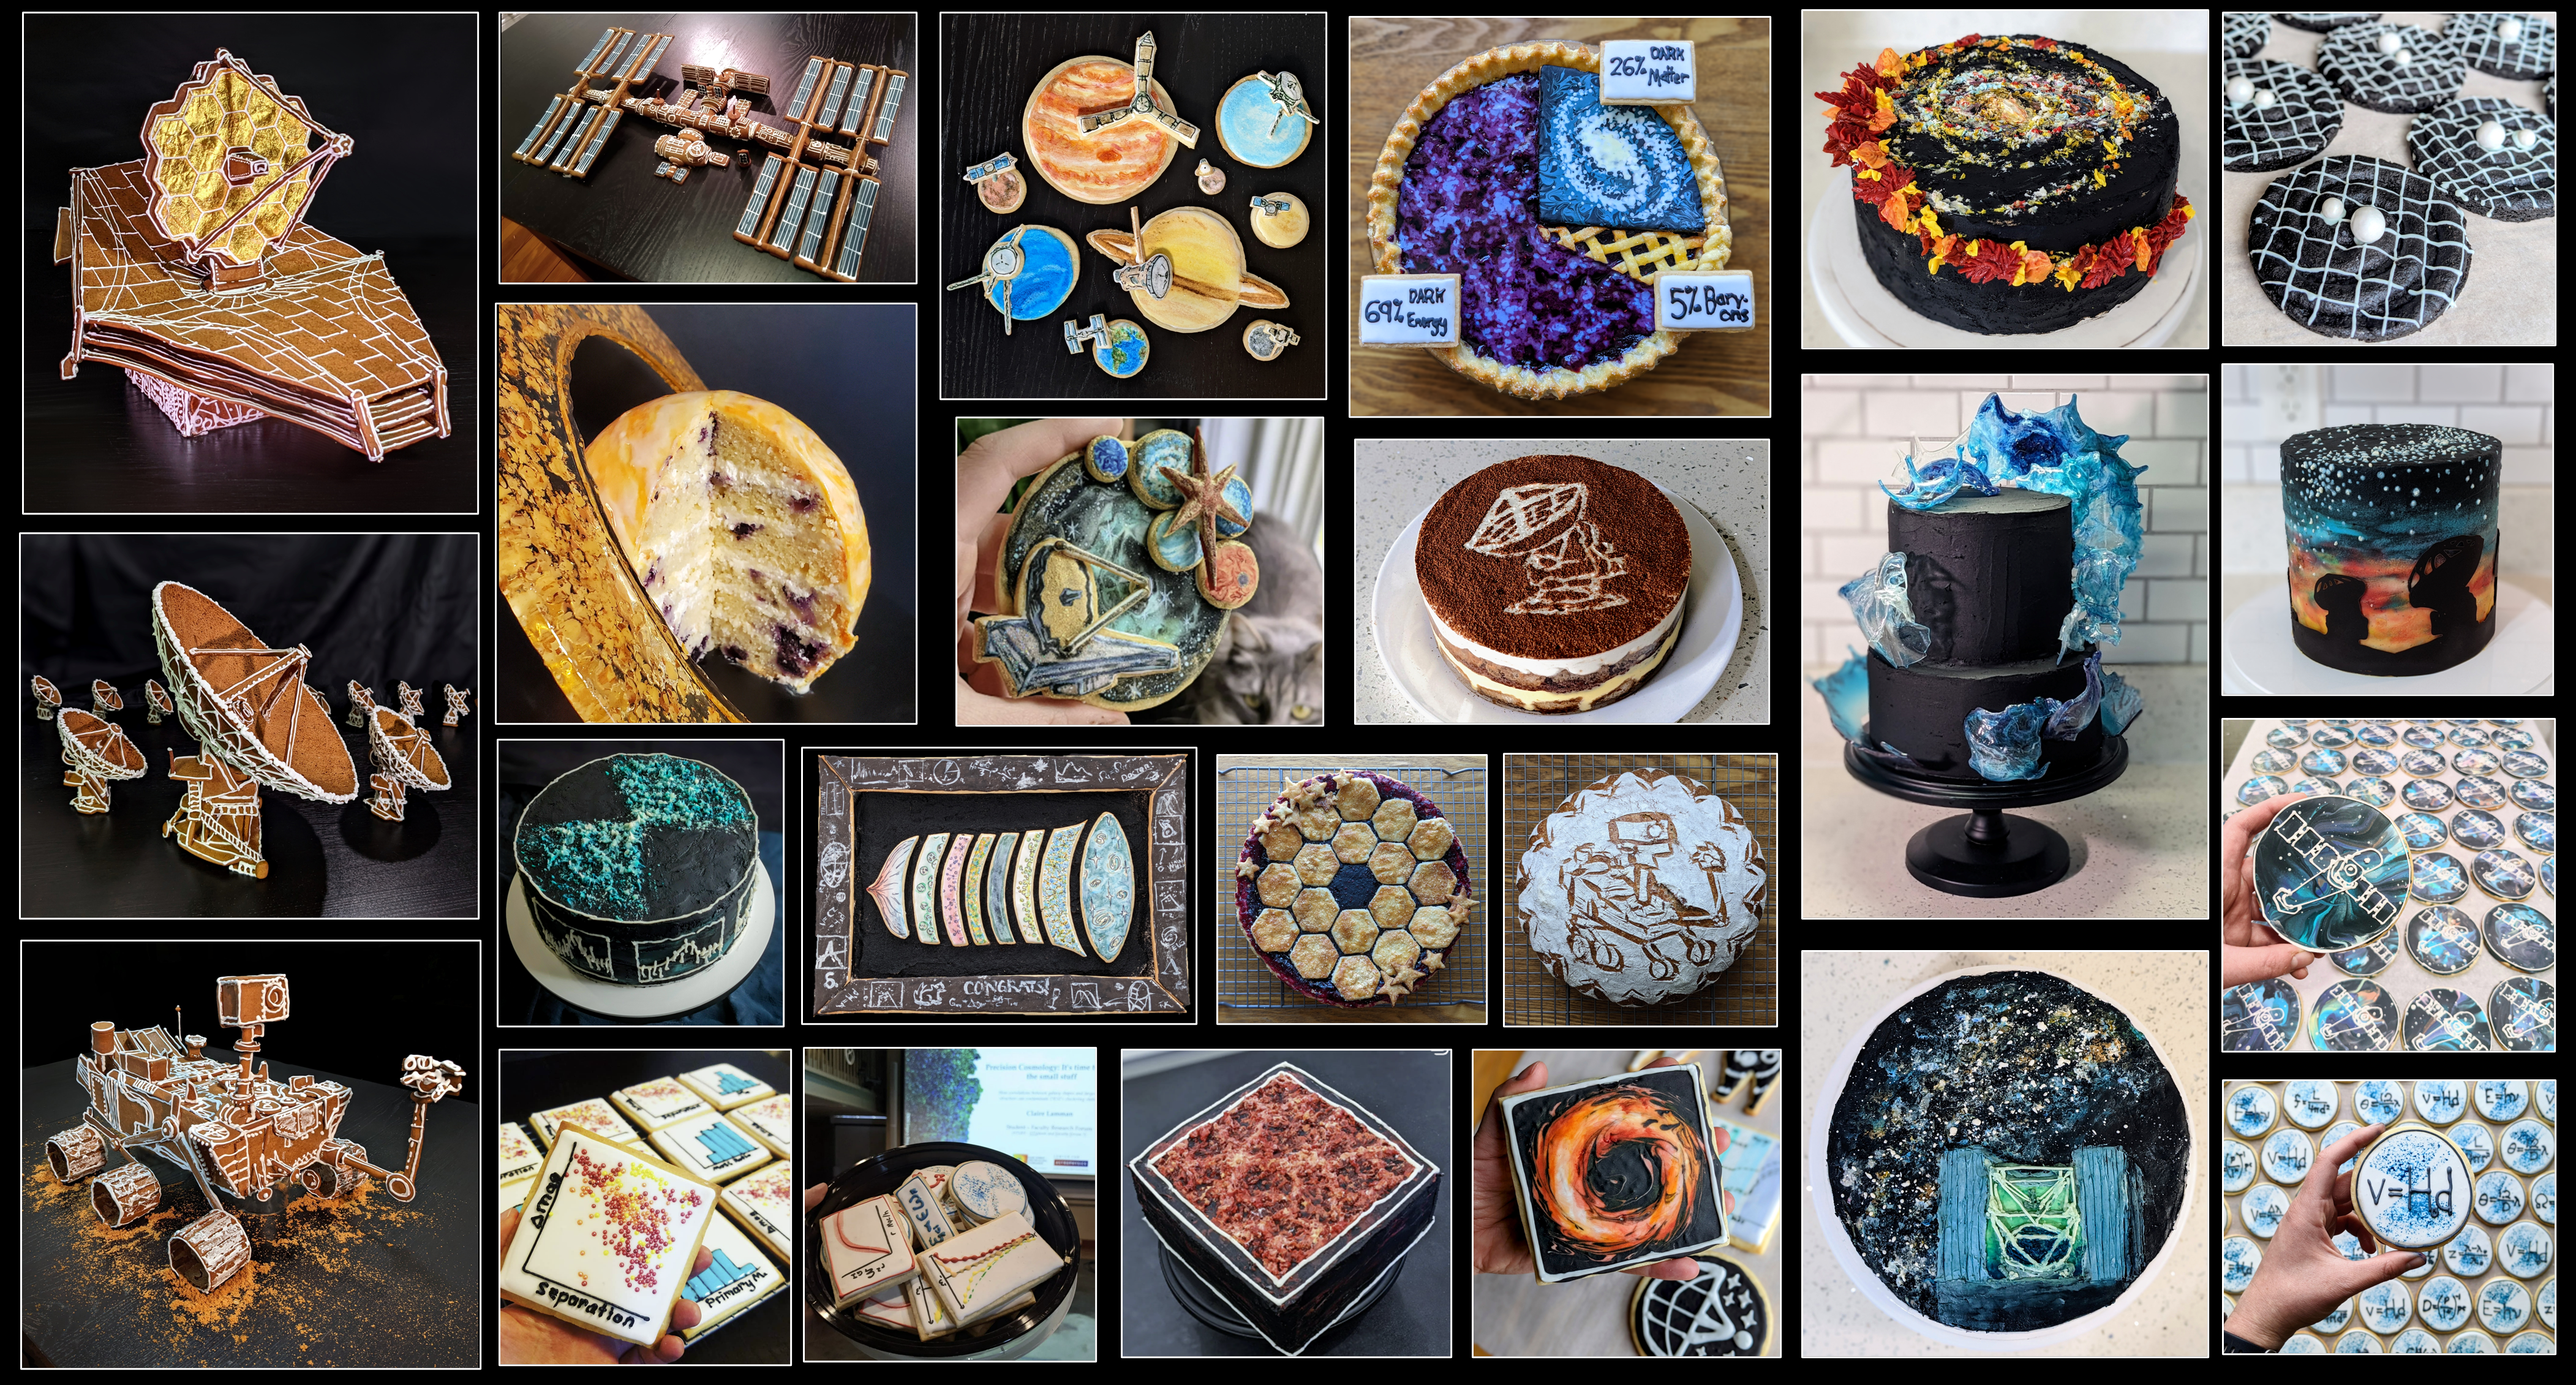
I create many astro-themed treats! To see all bakes and descriptions of the science which inspired them, see my Instagram.